
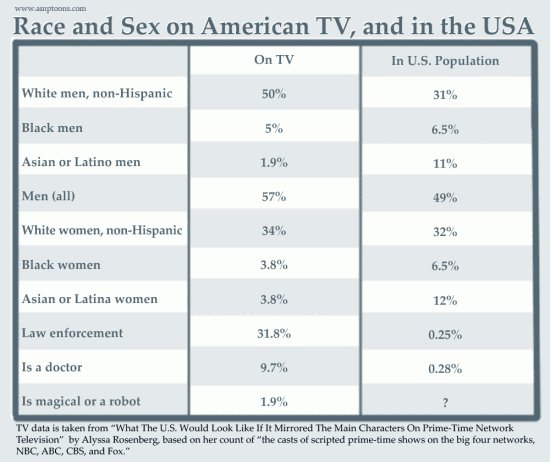
The chart above was created by a writer at ‘Amptoons‘; it combines writer Alyssa Rosenberg’s findings on TV representation by sex, race and gender with the actual demographics of each group in the United States. What’s missing, however, is what’s behind the scenes
Upon seeing the Amptoons’ chart, my first question was “How many of the people of color and women represented on the television shows surveyed actually play characters that star on the shows they are on, or at the very least have a nuanced characterization which is central to the show’s plot?”
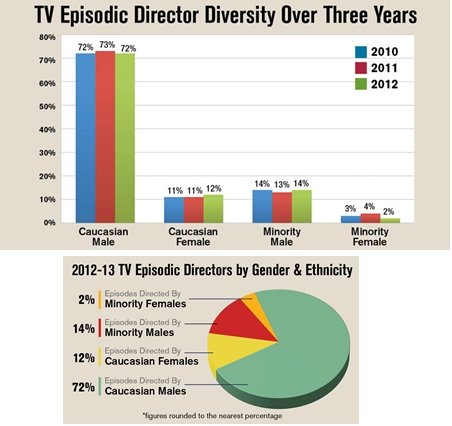
The following data, compiled by the Director’s Guild of America (DGA), reveals that while some of the disparities in percentages listed in the chart aren’t as great as some would think, the greatest chasm between representation and reality happening behind the cameras.

White males still direct over 75% of all episodic television shows, minority males direct 14%, white females direct 12% and women of color direct 12%.
In another set of findings by San Diego State University’s Center for the Study of Women in Television and Film, in the 2010-2011 season, women only wrote for 15% of the shows airing on broadcast networks during primetime.
With numbers like these, the continued hypervisibility of black women and black people on television should come as no surprise.